Supply Chain Mapping Deep Dive
IF YOUR PRODUCT IS MANUFACTURED IN THE SAME TERRITORY YOU ARE SCANNING, SHIPPING CALCULATIONS ARE NOT APPLICABLE, SO THIS SECTION WILL REMAIN EMPTY.
A step-by-step guide to navigating and interpreting the Supply Chain Mapping feature in Rove — illustrated with Rove Nature's Lather shipping from Shanghai to Los Angeles.
Rove Nature's Lather™ | Territory: 🇺🇸 United States | Category: Other Shower & Bath
Stage 1
Overview & Score
When you open your product in Rove and navigate to Supply Chain Mapping, the first thing you'll see is a summary and a score. The score tells you how strong your supply chain position is and highlights any considerations or potential risks that need to be taken into account.
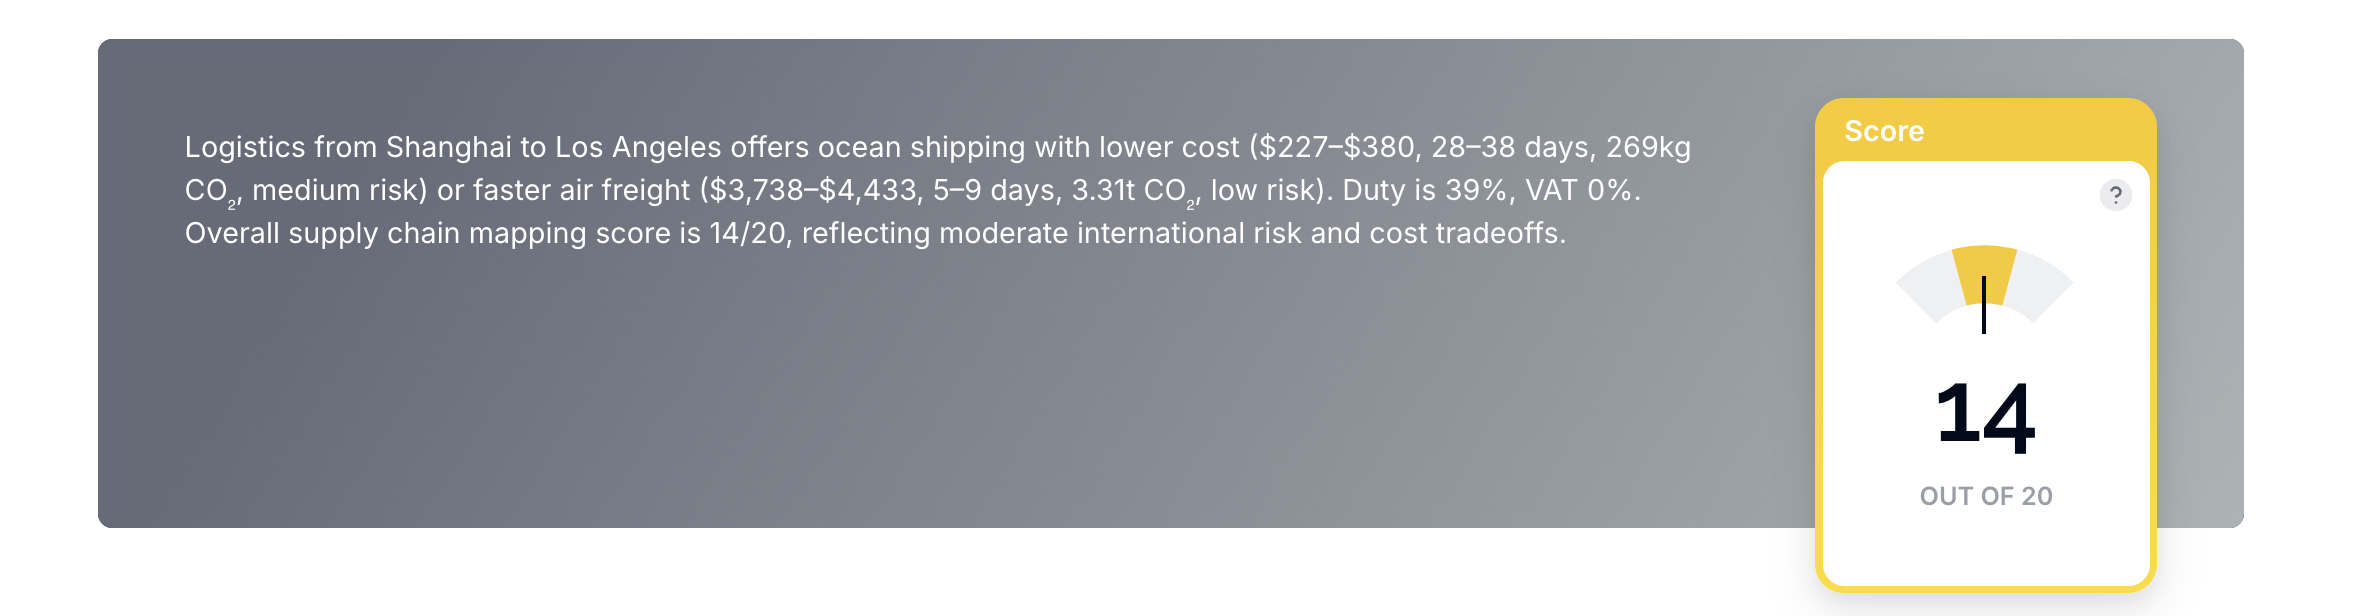
💡 Reading the score: The score reflects the overall viability and risk profile of your supply chain route. Read it alongside the summary for full context before diving into the detail below.
Stage 2
Estimated Shipping Costs & Times
Scroll down from the summary to find the Estimated Shipping Costs and Times section. Rove calculates costs and times across up to four different shipping methods: ocean, air, freight, road, and rail. These options appear based on viability for your specific route.
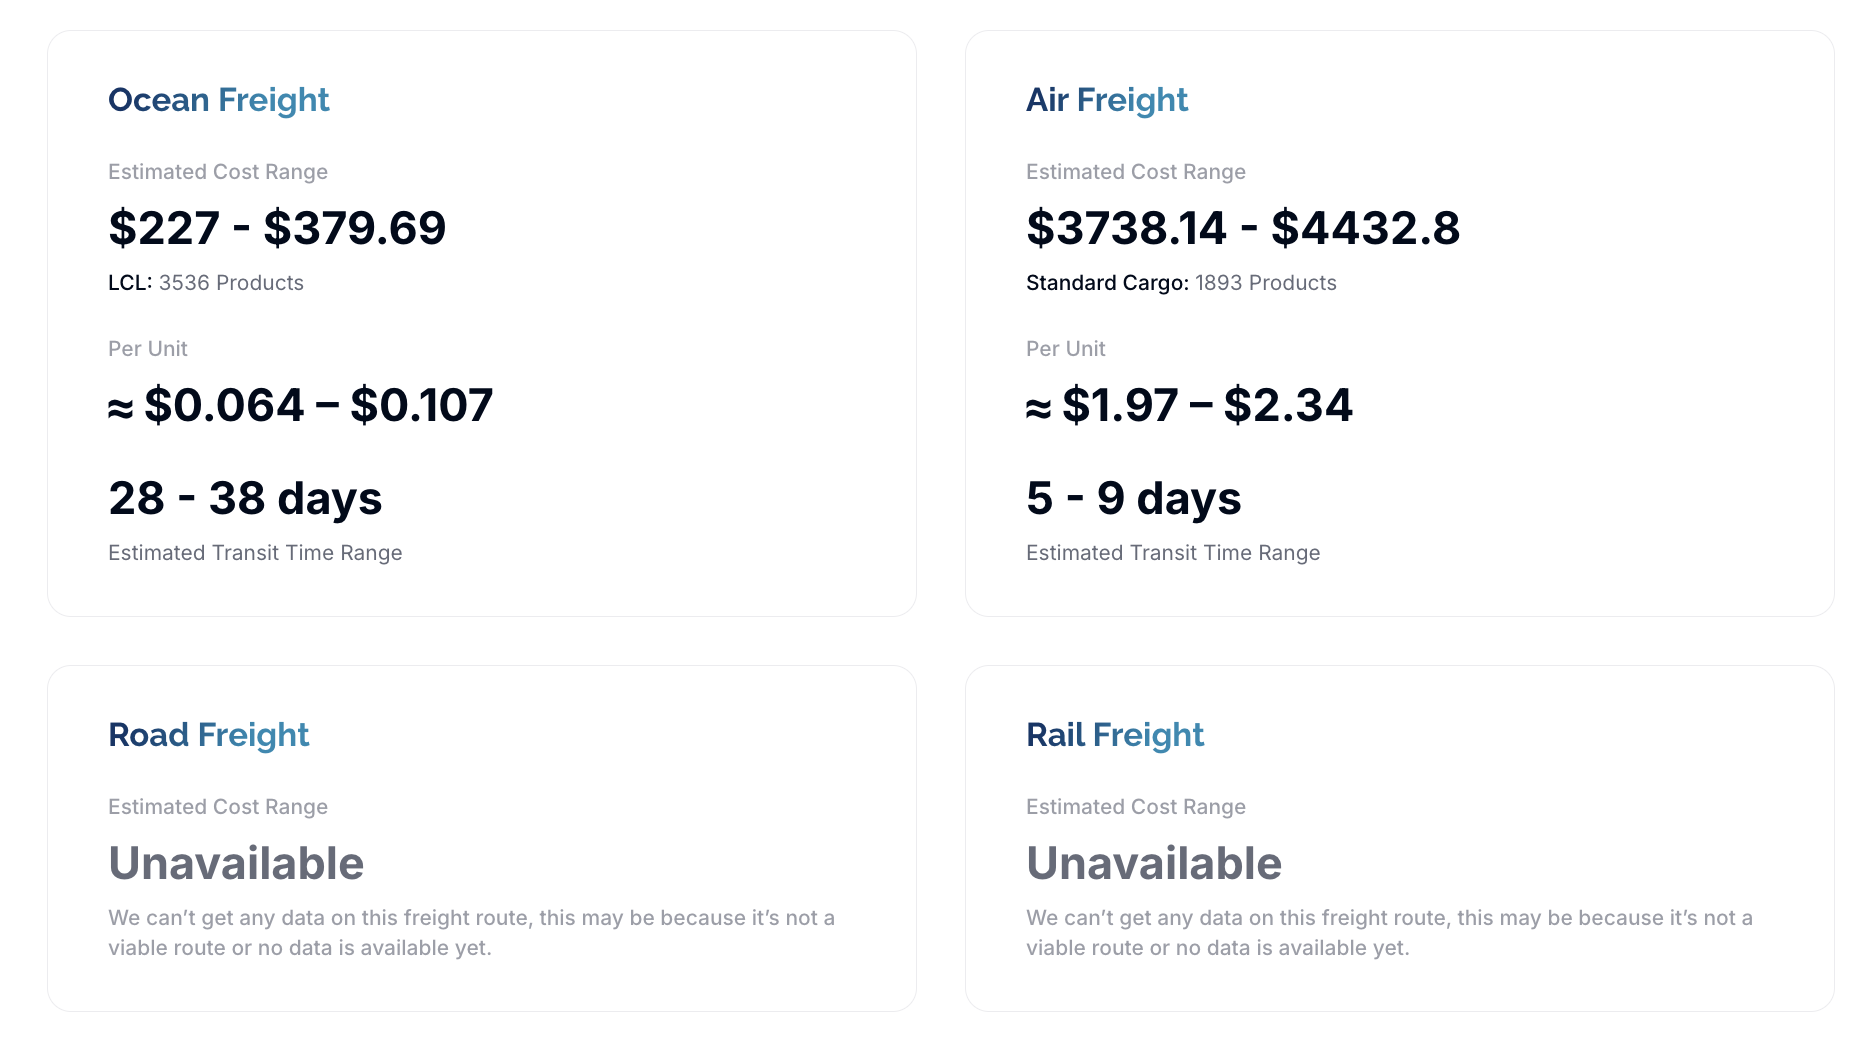
💡 Understanding shipping: For each viable method, you'll see an estimated cost range, including differentiation between shipping method which explains any differences in the number of products carried and the per-unit cost.
Stage 3
Taxes & Duties
Below the shipping costs, you'll find the Taxes & Duties section. These figures are territory-specific and will likely change each time you Scan - particularly given the frequency of international changes to tariffs and duties.
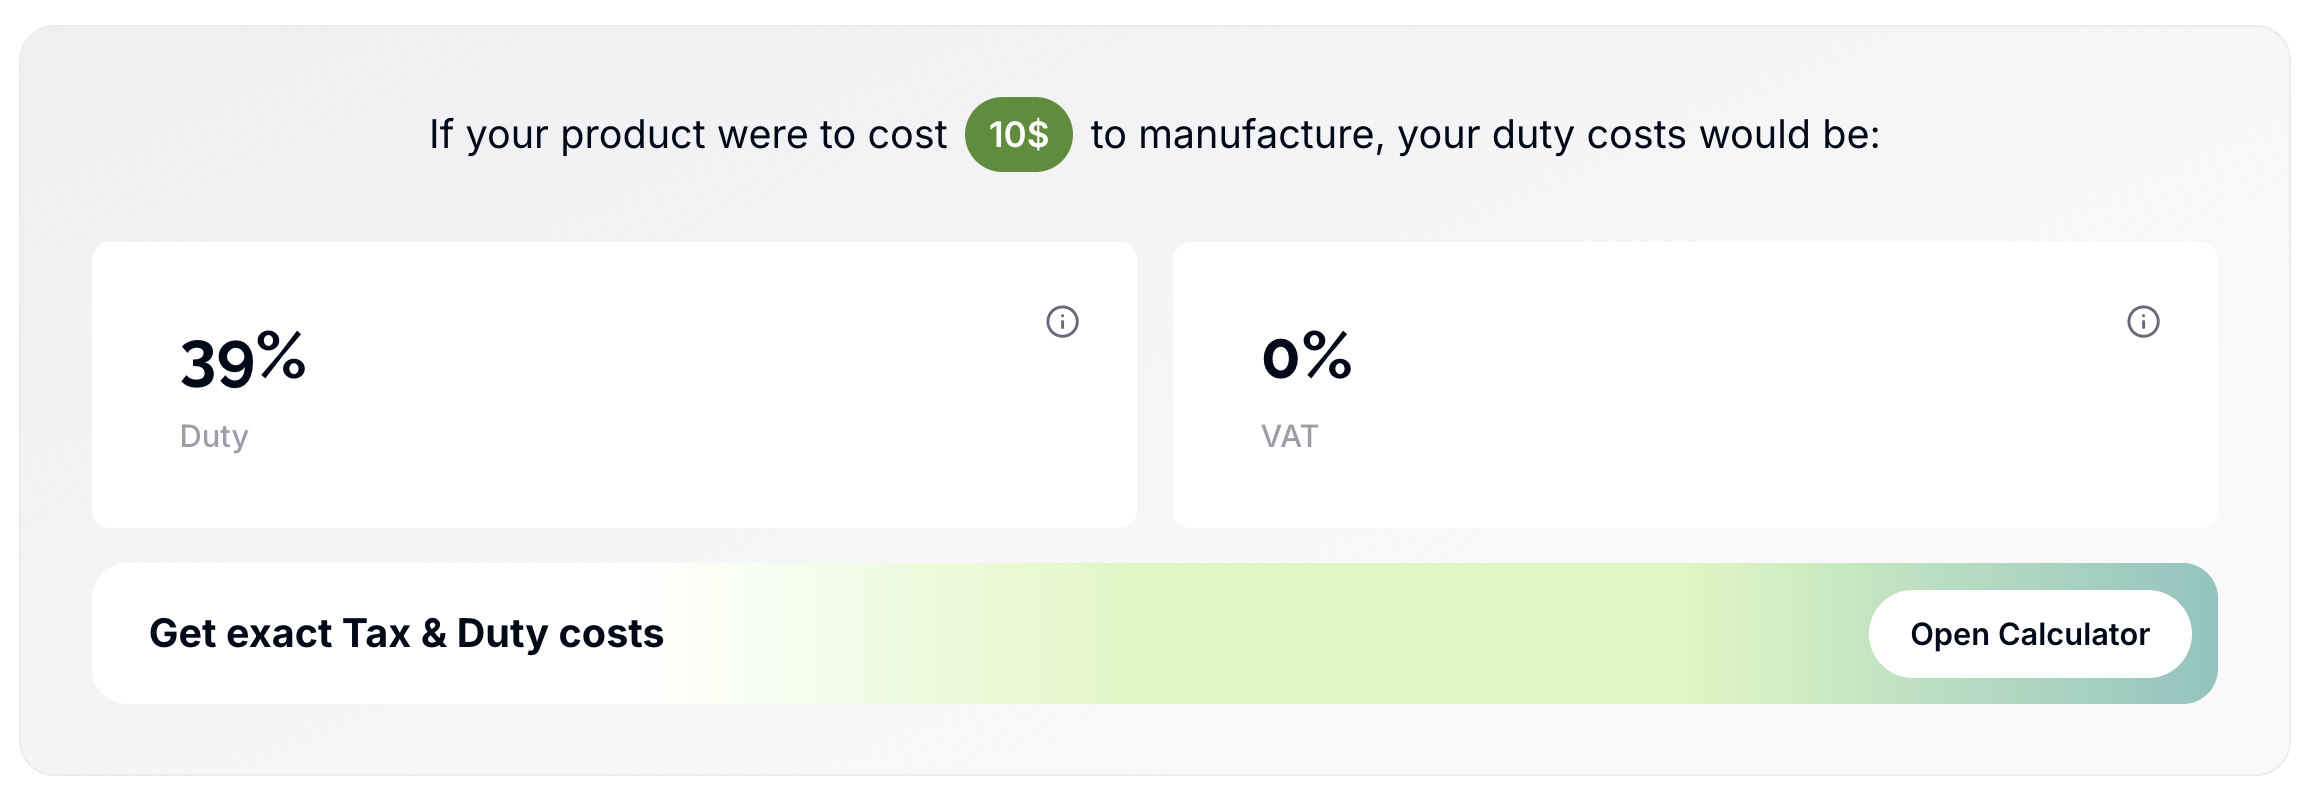
💡 Tip: Hit Open Calculator to input more granular information specific to your product to generate a more precise view of your total cost to market. The pre-populated figures on the calculator are your average shipping costs, HS Tariff code and Duty rate. You input the rest!
Stage 4
Logistics Risk Score
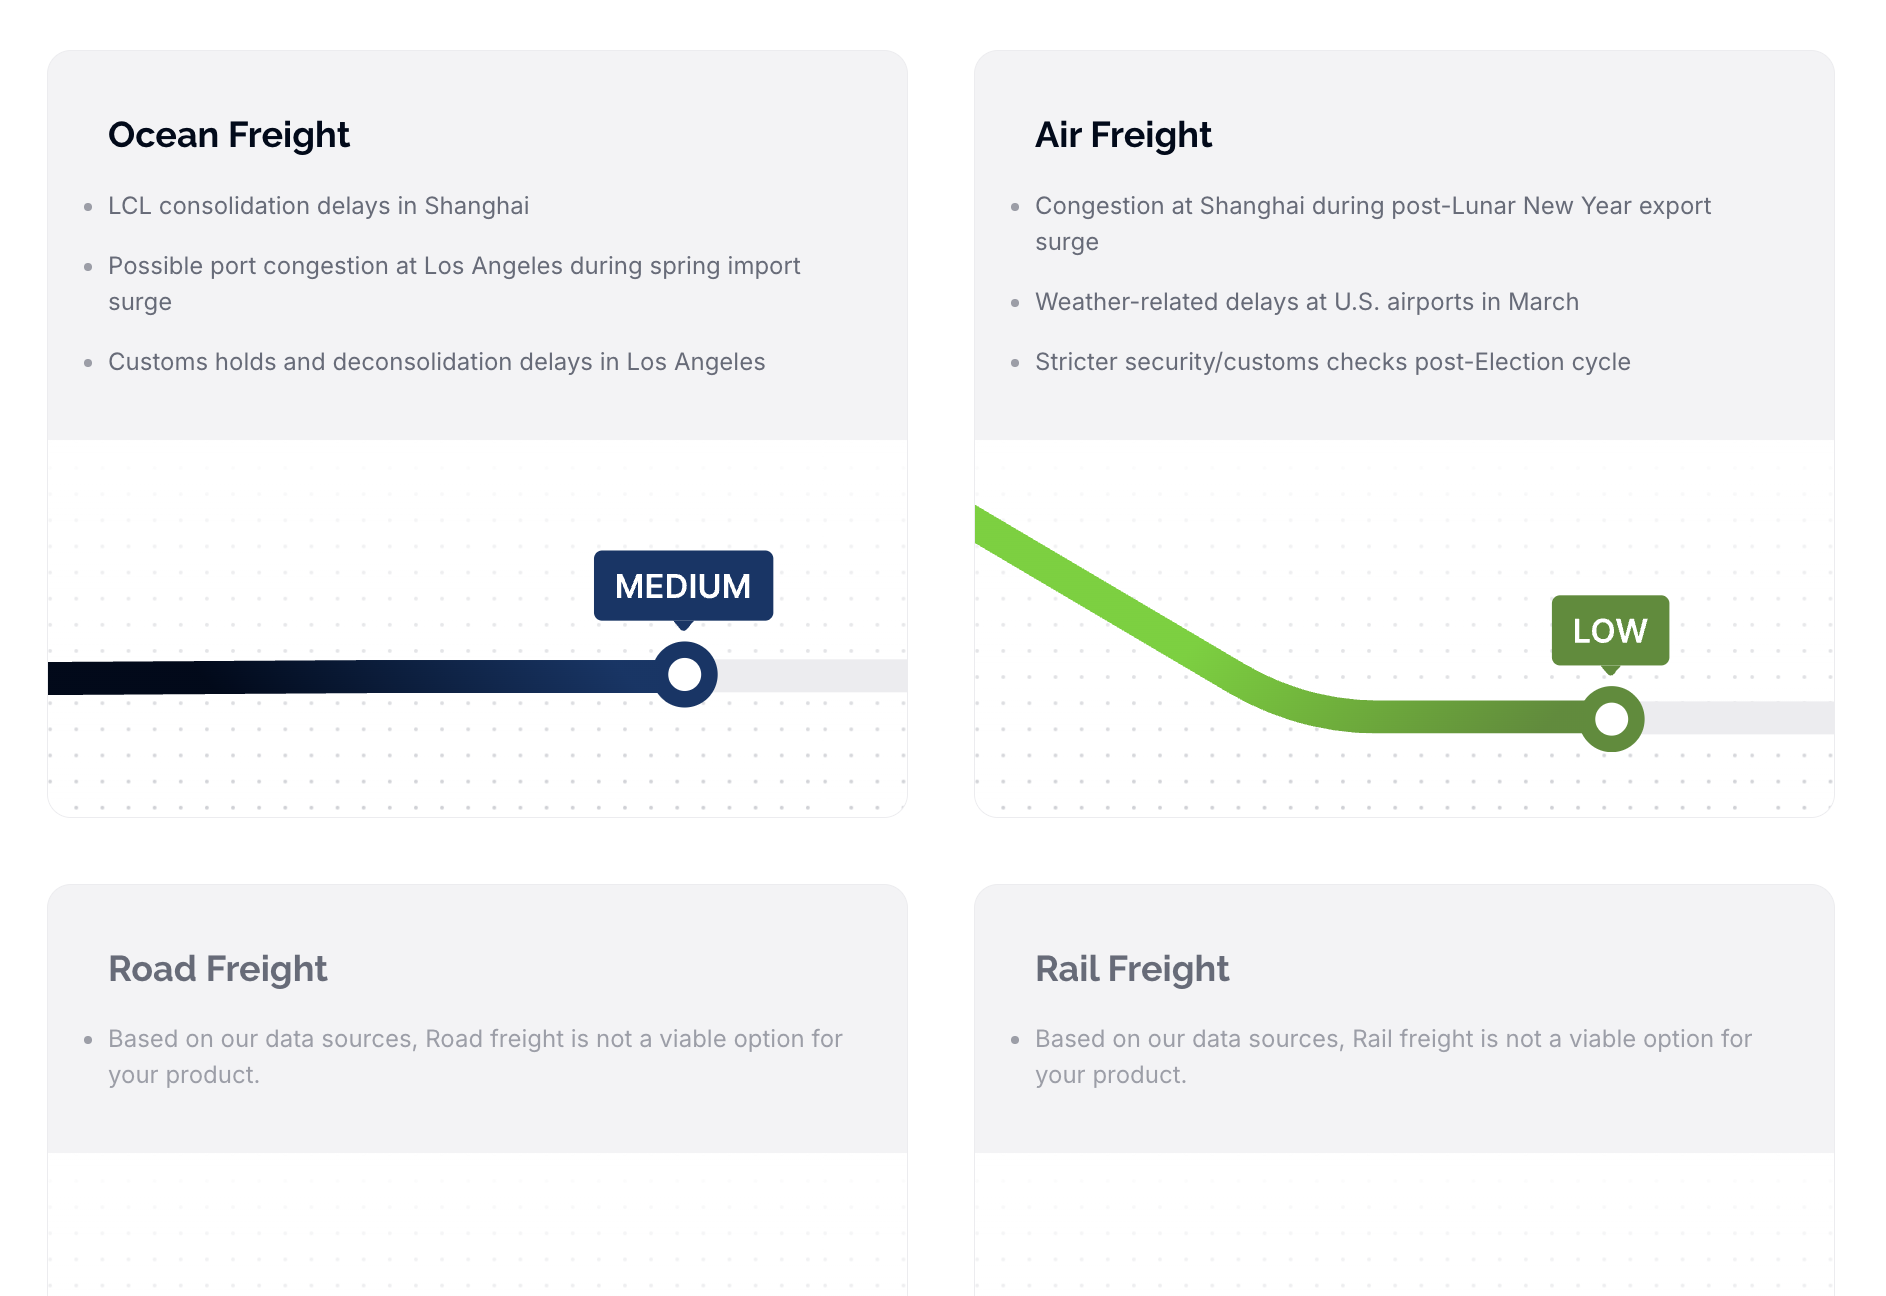
The Logistics Risk Score evaluates the key risk factors specific to your origin and destination - including weather, congestion, ports, security, and customs. Each factor is assessed in the context of where your product is travelling from and where it is going to, giving you a targeted view of where risk can be mitigated at every stage of the journey.
Stage 5
Sustainability
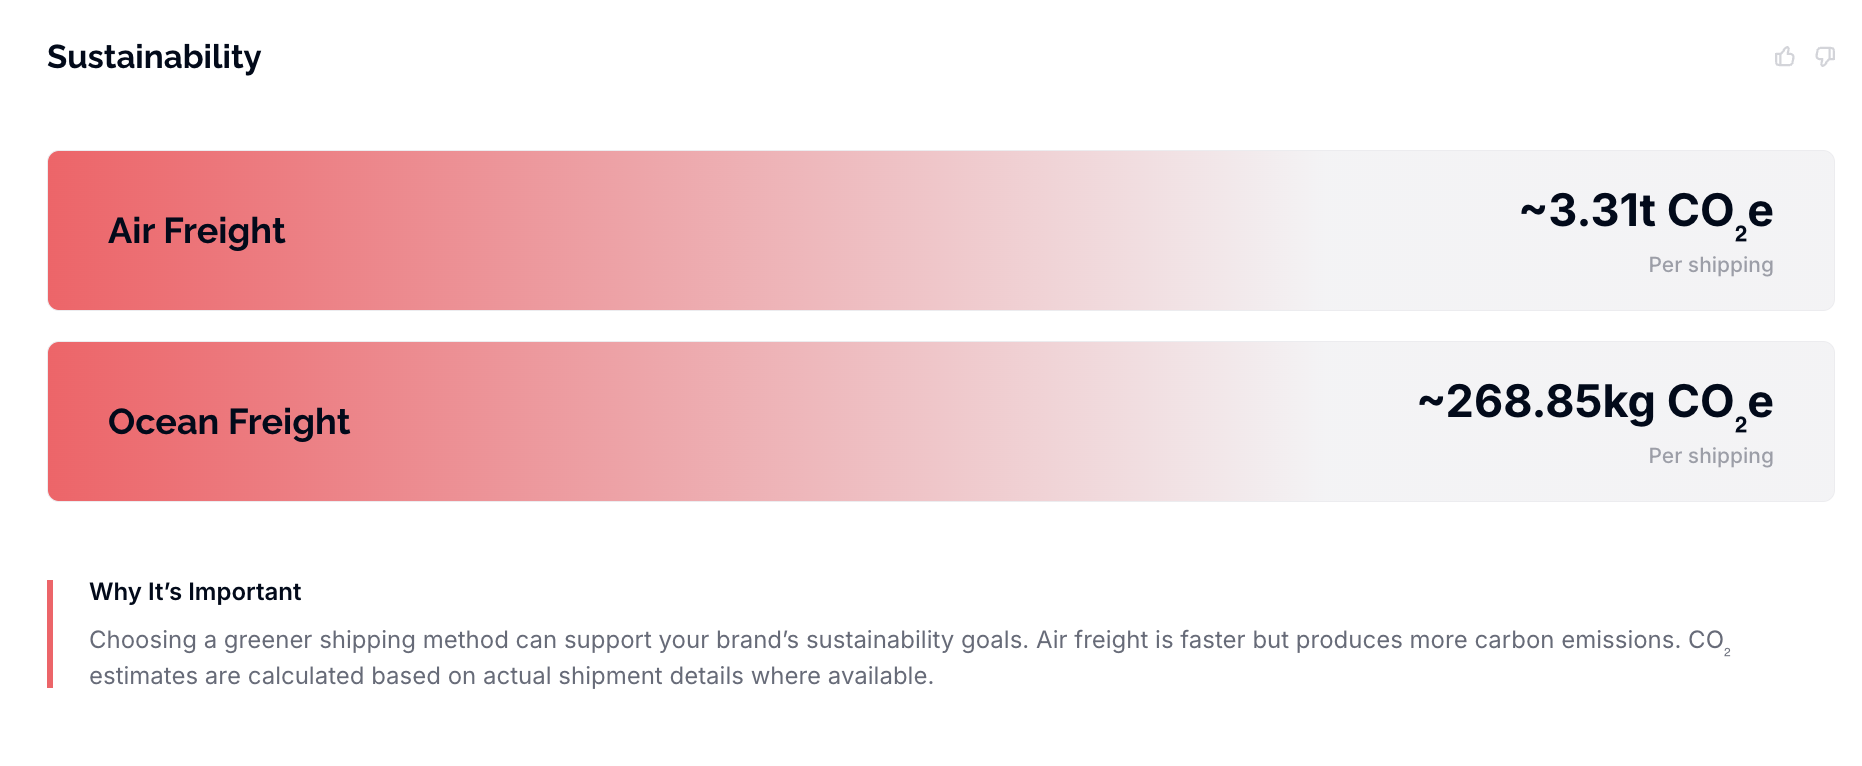
The Sustainability section shows the environmental cost of your chosen shipping methods. Where sustainability costs are high, this will be flagged clearly. Rove provides carbon emissions estimates for each shipping option - data that is increasingly required for regulatory reporting across many territories.
Stage 6
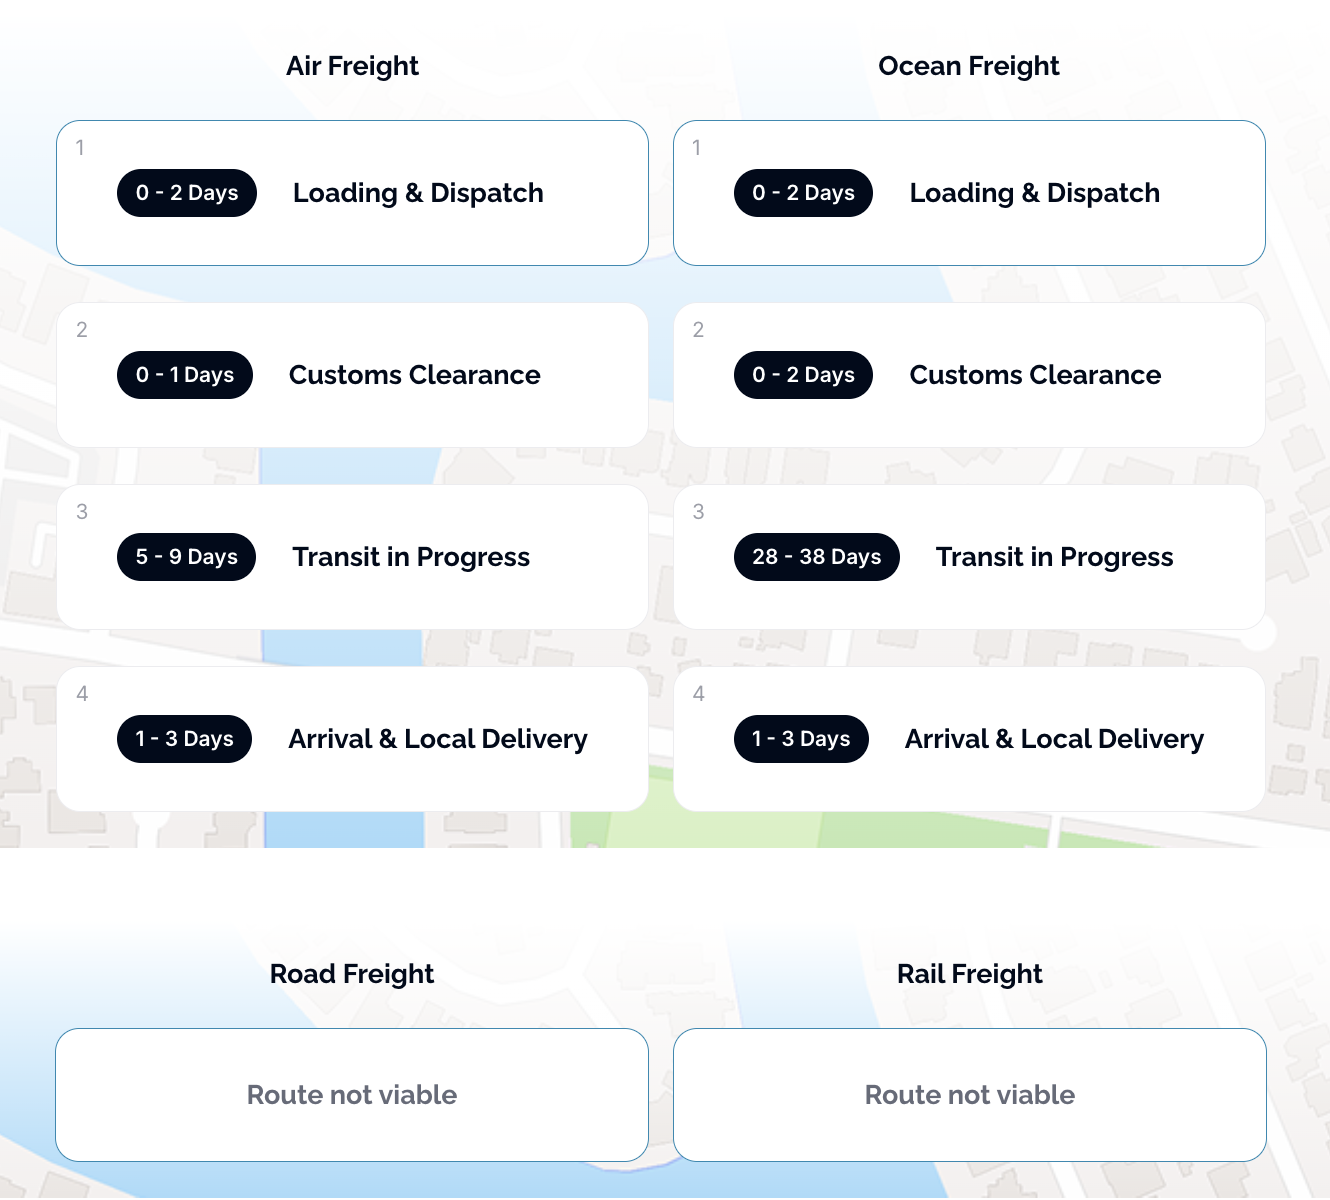
Shipping Timeline
At the bottom of the Supply Chain Mapping page, you'll find the Shipping Timeline. This gives you a visual representation of the full transit journey, including all key stages and the time required either side of the shipment itself.